This screen provides users with a view of their current On Hand amount and cost compared to their Forecasted Investment Inventory amount and cost. The top screen gives an aggregate summary view while the lower screen explores further SKUL details.
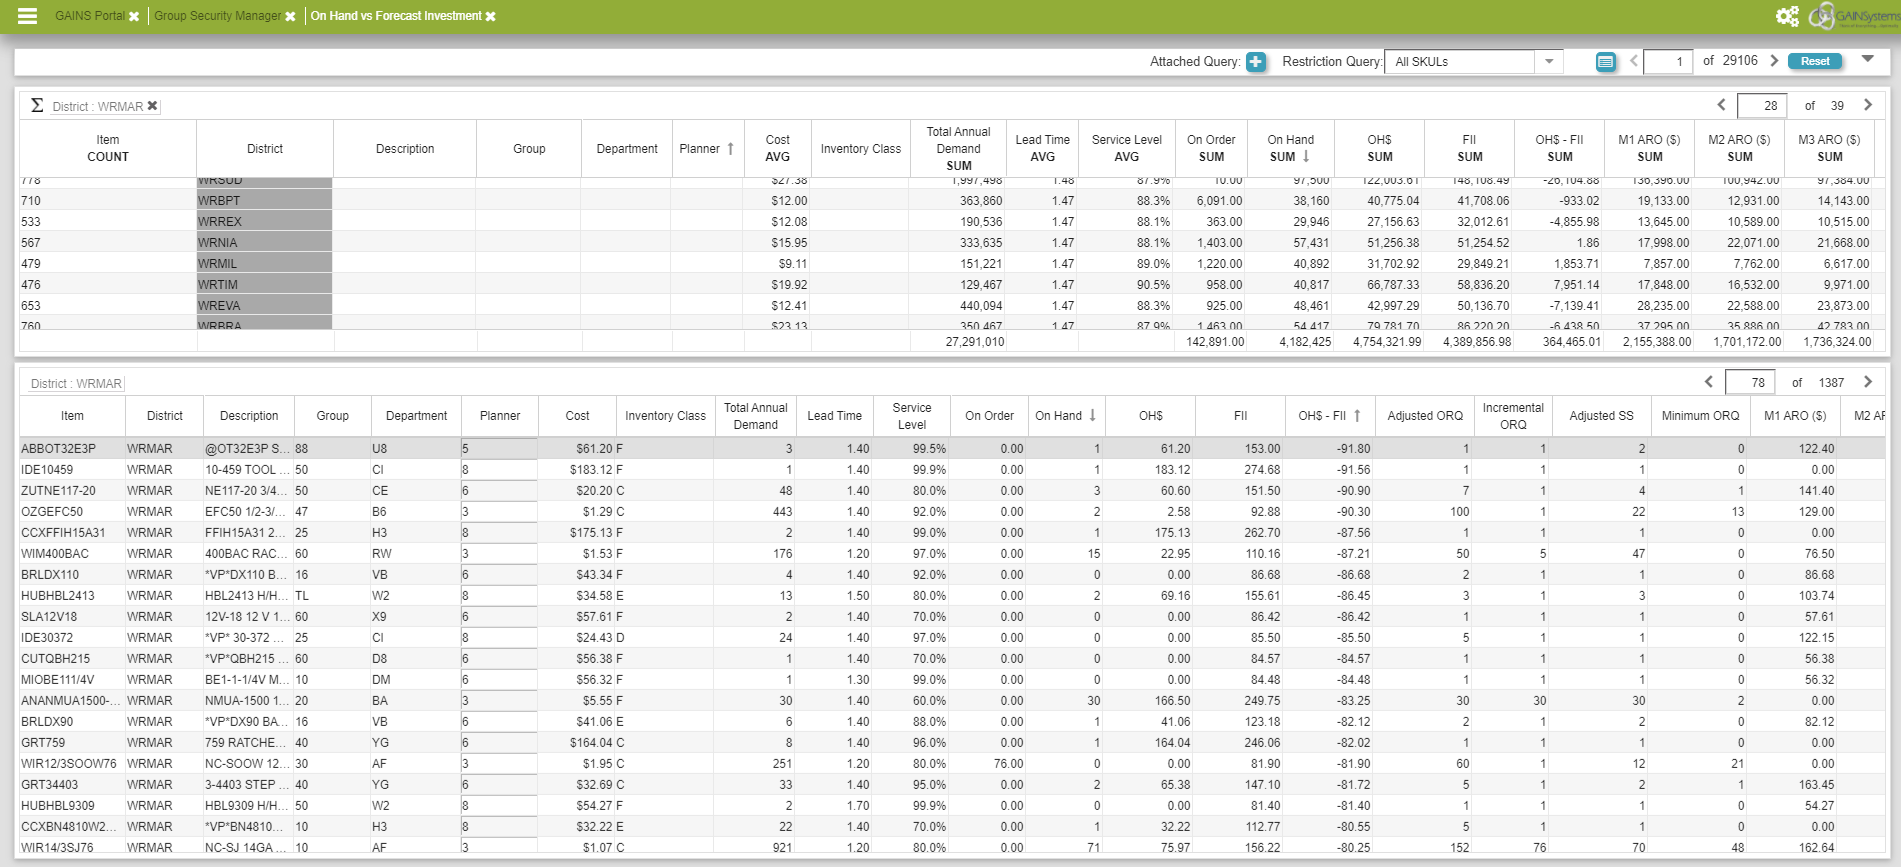
On Hand vs. Forecast Investment Screen
Description of Fields in On Hand vs. Forecast Investment
| Item | The name of the specific product that is being displayed. |
| District | Displays the current location of the product. |
| Description | A description of the product that is being displayed. |
| Group | The product class. |
| Department | The product family. |
| Planner | Displays the user who last updated the specific alias. |
| Cost | The unit cost for the product. |
| Inventory Class | Describes the priority level of the product. |
| Total Annual Demand | The total demand for a product over the course of a year. |
| Lead Time | The amount of time it takes for an order to be complete. |
| Service Level | Represents the percent of times an item is desired to be available for shipment in full amount and on-time; % order want to be completed. |
| On Order | Inventory orders that were already in place. |
| On Hand | Available inventory for use. |
| OH$ | The cost for the available inventory. |
| FII | The cost of forecast inventory investment. |
| OH$ - FII | The cost of available inventory subtracted by the cost of forecast inventory investment. |
| M1 ARO($) | The total cost for an Additional Replenishment Order for each month. |
| Adjusted ORQ | The adjusted Optimal Replenishment Quantity. |
| Incremental ORQ | The GAINS recommended Optimal Replenishment Quantity incremental amount |
| Adjusted SS | Adjusted Service Stock: the service stock directly adjusted by a user to account for variable change |
| Minimum ORQ | The minimum Optimal Replenishment Quantity recommended by GAINS |